|

Methology

Zooplankton dynamics are highly variable.
This depends on:
- the patchy distribution of zooplankton within the water column,
- on the variance in the timing and abundance of food availability and predator control.
- on the specific seasonality of the populations determined by the preceding climate (Greve et al. 2001).
Climatic effects are predictable over a time span of months while behaviour and trophodynamics happen in hours,
days and weeks.
Seasonal timing is predictable but not yet the future abundance of zooplankton populations.
The seasonal zooplankton prognoses makes use of the specificity of the thermal profile of each species,
which can be understood as a response of physiological process speed with a preset temperature response
function. This is independent of the Bertanlanffy Q 10 Rule, which may be incorporated in the species
specific functional response.
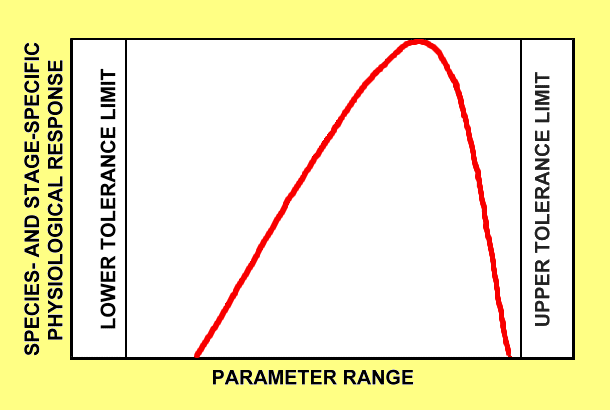
Figure 1: Scheme of the specific functional response curve.
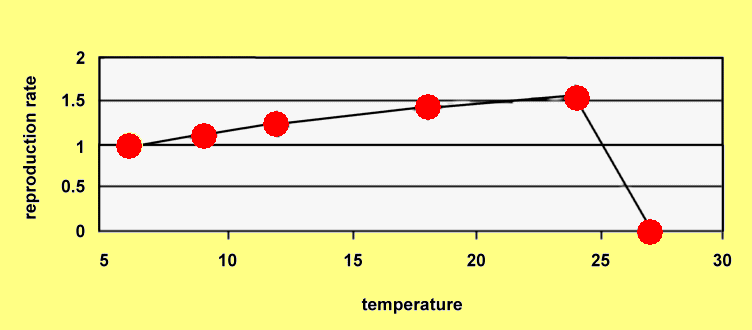
Figure 2: The functional thermal response curve of Noctiluca scintillans
after Uhlig and Sahling 1995.
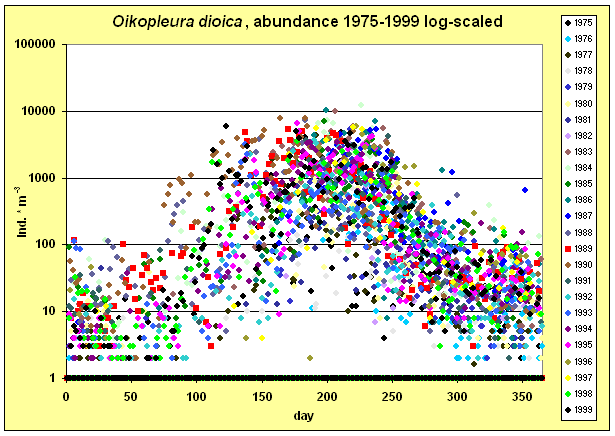
Figure 3: Log scaled scatter plot of the observed variance of the appendicularian
Oikopleura dioica at Helgoland Roads 1975-1994.
While the annual abundance, measured, is controlled by many variables The annual phenology
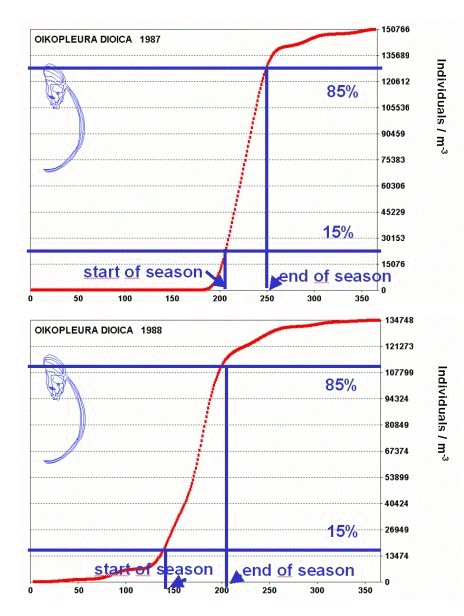
is maily controlled by the prceding temperature. The phenophases are defined as the 15 % and
the 85 % threshold transitions of the annual cumulative abundance sum.
|
Determing phenological events
The transition of the 15 % and the 85 % thresholds of the annual cumulative
abundance determines the start and the end of season as a time-related
phenological criterion.
The phenological date is correlated with temperature periods preceding
this event, varying timing and length until the best correlation coefficientcan be determined
Greve Wulf, Uwe Lange, Frank Reiners and Jutta Nast (2001):
Predicting the Seasonality of North Sea Zooplankton
In: KRÖNCKE, I. & TÜRKAY, M. & SÜNDERMANN, J. (eds), Burning issues of North Sea ecology,
Proceedings of the 14th international Senckenberg Conference North Sea 2000,
Senckenbergiana marit. 32, in press
|
Figure 4: Phenological determination on the season of Oikopleura dioica in 1987 (cold) and 1988 (warm, see next figure).
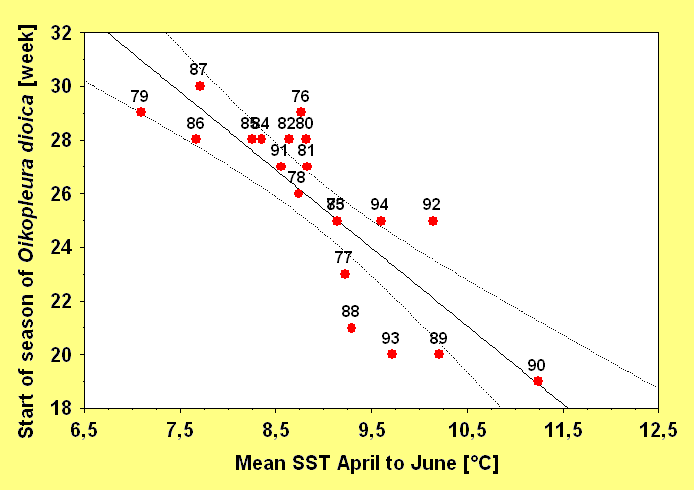
Figure 5: Regression of mean SST April to June [°C] and annual timing of the start of season
in Oikopleura dioica.
The automated phenological analysis calculates the optimal prognostic value from the available
time-series on the basis of temperatures, phenophases and corresponding weeks.
The calculation is finalized when further value modifications no longer improve the prognostic probability.
|